Power BI: Data Wrangling and Fish

Danielle Degiorgio, Digital and Information Literacy Project Adviser, Edith Cowan University Library
Sue Khoo, Librarian (Digital and Information Literacy), Edith Cowan University Library

What is Power BI?

Power BI is a Microsoft data visualisation tool that displays data in an easy-to-read format and allows users to interact and show relationships between different data sets.

Why Power BI?

Our goal was simple, we wanted to connect the mapping of digital and information literacy skills across the course curriculum to the teaching and learning activities we were doing each semester. We just had one problem, we were recording our data and statistics in multiple spreadsheets.

As luck would have it, the 2021 VALA Tech Camp was hosted at Edith Cowan University Library that year and we were introduced to Power BI through a series of workshops. Soon after we decided to use Power BI to help us keep track of student statistics in a more visually appealing way and it let us connect multiple sources of data. This meant we could compare, filter, and visualise relationships between multiple spreadsheets which allowed us, and more importantly our manager, to see our progress across courses.

Power BI: Visualisation of mapped digital and information literacy skills in courses.

Things we got Power BI to do:

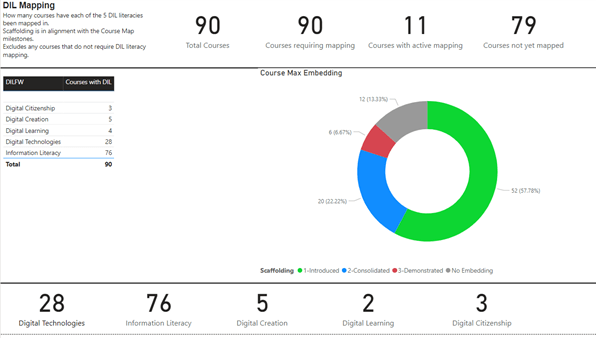
  • Connect information from multiple spreadsheets to show how much digital and information literacy skills coverage we have in each course. 
  • Filter and display subsets of data. 
  • Be hosted in Microsoft Teams for ease of access where the report can be shared and displayed as a tab in Teams. 
  • Automatically update data from SharePoint, so having all our sheets hosted on SharePoint / Microsoft Teams mean we can easily add data into the model. Our Power BI reads directly from SharePoint files and updates at 9am every day.

Skills: What magic do you need?

  • Spreadsheet and table management – Power BI relies on external data. You must have the data cleaned and stored in a data source such as Excel (or databases such as Salesforce or Access).
  • Logic and relationship management – Connections can be 1-1 and 1-many but only one model may exist at a time. If there are conflicts Power BI will complain.
  • Ability to play with formulas and data types – If you need a relationship that isn’t expressed in the Power BI map you will need to learn to write the formula for it.
  • How to put together a graph – Knowing what graph suits your needs be it a scatter plot, ribbon chart, pie chart, or fish.
  • Professional Google skills – If something goes wrong, be ready to Google it!

Pitfalls: What to watch out for

  • A lot of trial and error and Googling – No training will prepare you for what you want to do. There may be things you want to do but Power BI only gives you the basic tools. You will have to build what you want from there.
  • Broken or dirty data – Power BI relies on relationships between different tables and inputs to build the model. If a piece of information is missing and if that is the connection in the model, it will skip that line. This has resulted in expectations not meeting what was displayed.
  • Know your data story – Power BI does not do data interpretation. You need to know what you want to tell. This is one of the main issues on the final display of information.
  • Permissions – Our shared spreadsheets and the dashboard were stored in places where we didn’t have full access to use. Arrange the files so each input has the right permissions to do SharePoint integration.

How do you get started?

But what about the fish?

The most important thing to remember is to be creative and have fun with your data!  

Power BI: Number of students seen per School using the Enlighten Aquarium visual. Enlighten Aquarium won a people’s choice award for the ‘Power BI Best Visual’ contest in 2016.

Day 3 of Championing the Digital Dexterity Framework Virtual Festival – The good, the bad and the ugly of digital identity and data

by Marianne Sato, Project Officer, Data, Digital Learning and Publishing, University of Queensland

Day 3 of the Championing the CAUL Digital Dexterity Framework Virtual Festival was all about Digital Identity and Data Literacy. We saw the good and the bad of digital identity and data.

The bad

Is your online activity a digital tattoo that you may come to regret and won’t be able to remove?

Terra Starbird (Digital Literacy Trainer) from Australian National University told us that “every single thing you do online is a digital tattoo.”  This includes work emails, private emails, social media, searches and purchases. We were horrified to see just how much Google knows about our lives – our relatives, friends, locations we visited, illnesses we looked up and our “celebrity crushes.”

A person with a tattoo spelt as “NO RAGRETS” across their chest.

Big data is a threat! 

Tools and apps can scrape all your online data and the data on your smartphone. Terra told us that corporations will pay to have employees’ online activity analysed to get an insight into behaviour, personality and intelligence. It can be “career ending.”

Raise awareness

Terra asked, “As librarians, should we be about helping people stem that flow of information?” Should we share tips and tools to check online activity, clean up where possible, protect private information and search anonymously? If we raise awareness of the data risks, and the ways to combat it, we can help our clients to make the most of their digital identities. 

The good

Social media has the potential to provide amazing personal and work opportunities.

Kim Tairi, Kaitoha Puka (University Librarian) from Auckland University of Technology showed us the importance of social media for librarians to communicate, build relationships, develop professional circles and “lift up the profession.” 

But it is not without risk!

Kim has chosen to be her authentic self rather than adopt a “brand” that shows an edited version. Kim explained that sometimes it has led to tears. Kim’s tips on making the most of social media include:

  • Plan – think about your goals and values
  • Stop and think
  • Be true to yourself and it will evolve over time.

Kim’s recommendations of Twitter accounts to follow that lift up the profession:

  • @janecowell8
  • @clauersen

Good use of data

Even though our data can be used in a way that threatens our privacy, there are also amazing, ethical uses of data. Data can be used to tell a story, visualise information and gain insights.

Masami Yamaguchi (Librarian), Brett Parker (Senior Programmer and Software Support Officer), and Amanda Miotto (Senior eResearch Analyst) from Griffith University introduced us to data storytelling. They teach researchers to “frame their ideas for their audience” using techniques and tools to create visualisations from their data and a narrative that leads to “memorable research.”

Charles Barnett (Library Business Partner, Design and Social Context) from RMIT University Library presented on the Work Integrated Learning (WIL) Project to explore a visual representation of searching activities of the RMIT Community. It was a great example of engaging their community and filling digital capability gaps.

Clayton Bolitho (Research Outputs Data Advisor) from La Trobe University demonstrated Tableau Public, a tool to “help people see and understand data.” At LaTrobe it is used to analyse resource usage, open access publications and to help researchers measure their research’s attention, value and engagement. Clayton recommends trying Tableau to get a better understanding of data.

Bruce White (Open Access and Copyright Advisor) from Massey University explained the value in having coding skills to pull in data to provide rich insights. Bruce learned Python “through a literal accident” and became involved in the Council of New Zealand University Librarians Open Access Environmental Scan in early 2019, to write an extensive program to pull in data from predominantly open sources that gave the universities rich insights into their performance. Bruce recommends to “start simple and invest time to learn the basics.” Check out Bruce’s book – Spreadsheets for Librarians : Getting Results with Excel and Google Sheets. 

The ugly?

All the sessions were about taking positive actions so there wasn’t actually any “ugly.” But special mention could go to:

•    Big data being used in unethical ways

•    Nemeses looking at your social media. Kim’s hot tip: You are being watched!


DigiDex – Championing the CAUL Digital Dexterity Framework – Day 3, Wednesday 3 February 2021

open video in new tab