By Leah Gustafson
Leah is working for the Languages Data Commons of Australia project. It is a University of Queensland and ARDC co-funded project building digital infrastructure for preserving language data. They provide support to researchers and the broader community around making language data FAIR with CARE.
(This post is in part a summary of an article that first appeared in The Living Book of Digital Skills).
It seems that every which way we turn, the mysterious concept of data is ever present and lurking in the background of our everyday lives. In the professional setting of the library, data is not a foreign concept – we are surrounded by books and journals and often help students navigate the world of information. But being in such close and constant proximity to data can lead to elements of expert bias creeping in despite the best efforts to keep them at bay! This can make it difficult to explain data concepts in simple terms.

So, what are some ideas for demystifying the concept of data for a wide audience? Particularly those who might be exposed to many different types (and potentially without even realising)…
First, the word itself. Remember that in its purist form data isn’t just digital! Wikipedia defines data as a “unit of information” about a person or object that could be a fact, statistic, or other item of information.
And then to progress to modern contexts (as so much of the data we deal with is digital), the Oxford English Dictionary entry states that it can be “quantities, characters, or symbols” in the form of electrical signals that can be used, stored, or transmitted with computer equipment.
Once there is an understanding of what data is, trying to explain it further can suddenly become wildly more complicated! It may be helpful to compartmentalise that data can be structured, meaning that it is ready for analysing. Otherwise it may be unstructured because perhaps it has just been collected or perhaps multiple data sources are being combined to created a larger dataset. A dataset is just a collection of data points that are together – maybe they came from the same source or maybe they are about the same topic.
Terms that many people will be familiar with are qualitative and quantitative. Qualitative data is an opinion or generalisation about something – a user gives a rating of 5 out of 5 for their experience watching a film. This type of data can be descriptive, be true or false, or give a rank. On the other hand, quantitative data is an objective measurement of something and it generally numerical – for instance, the piece of string is 23 centimetres long. They can also be a number of items or the number of times something happened: there are 2 dishwashers and 1 cupboard and the cupboard was opened 46 times today.
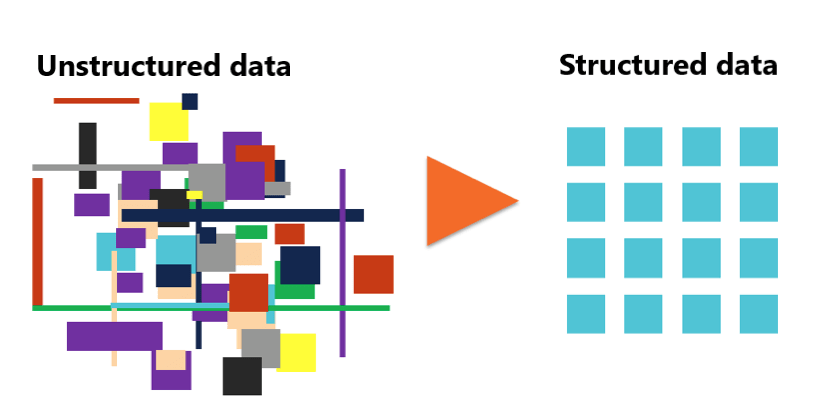
For data to be used in an analysis, it must be structured in such a way that a computer program can interpret it. For example, data that is output from remote sensing equipment is generally already structured, whereas data that is gathered in a survey where someone’s experience was described would be unstructured.
This has been a very brief introduction to the intriguing world of data! More information can be found in the Chapter 2: Information literacy, media literacy and data literacy – Types of Data section of the The Living Book of Digital Skills. There are also some helpful resources that provide more in-depth details about the fundamental data concepts discussed.
Sharing is caring: comment below on techniques and approaches that you find helpful when needing to explain data concepts!